- 名稱:RadarScope
- 版本:3.5
- 分類:天氣
- 系統:4.1 以上
- 官網: Home
- 內容分級:3 歲以上
RadarScope介紹:
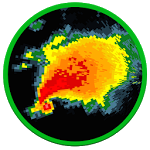
RadarScope is a specialized display utility for weather enthusiasts and meteorologists that allows you view NEXRAD Level 3 and Super-Resolution radar data along with Tornado, Severe Thunderstorm, Flash Flood Warnings, and predicted storm tracks issued by the US National Weather Service. It can display the latest reflectivity, velocity, dual-polarization, and other products from any NEXRAD or TDWR radar site in the United States, Guam and Puerto Rico, as well as reflectivity and velocity data from Environment Canada radars . These aren’t smoothed PNG or GIF images, this is native radar data rendered in its original radial format for a high level of detail.
Whether you are scanning reflectivity for a mesocyclone’s tell-tale hook echo, trying to pinpoint the landfall of a hurricane’s eye wall, or looking for small features like velocity couplets in the storm relative radial velocity product, RadarScope gives you the power to view true radial NEXRAD weather radar on your Android device.
When there are any Tornado Warnings (outlined in RED), Severe Thunderstorm Warnings (YELLOW polygons) , or Flash Flood Warnings (GREEN polygons) in effect throughout the US, tap the warning button in the top right corner to browse the list of current warnings, view the details, and even zoom to the selected warning on the map.
Pinch or stretch to zoom in and out. Drag your finger around the map to scroll. Tap the radar sweep button in the toolbar to switch radars. Select one of the 156 different NEXRAD radar sites and 45 Terminal Doppler radars in the US, 30 other radar sites in Canada, and2 in the Republic of Korea. Plot your current location by tapping the location button and optionally report it to the Spotter Network. Tap the play button to download and animate over recent images. Display the names of over 25,000 cities and towns on the map as you zoom and scroll. Tap and hold the color legend to see the data values.
Meanwhile, RadarScope will retrieve and display updated data automatically and intelligently (approximately every 2 to 10 minutes, depending on the radar scan strategy) .
You can display data from NOAA’s public access web site, our optional WDT feed (the default), or your AllisonHouse subscriber account. Spotter Network members can report their location and view the locations of other spotters.
The RadarScope Pro subscription is an optional auto-renewing subscription with two different tiers to choose from. Super-res products are still available to all RadarScope users without purchasing a subscription.
RadarScope Pro Tier 1 provides access to real-time lightning data that animates along with the radar loop and up to 20 frames of radar data, including *extended loops* of Super-Res Level 2 data. Tier 1 subscribers can also access a data interrogation tool to quickly determine data values for specific radar pixels and an optional dual-pane mode for viewing two radar products side-by-side.
RadarScope Pro Tier 2 combines all the features in Tier 1 with more advanced features, including a 30-day archive of all radar products, estimated hail size contours, rotation (azimuthal shear) contours, and the ability to use subscription features across multiple platforms.
If you choose to buy the RadarScope Pro subscription, it will charged to your Google Play account. Subscriptions renew automatically, and you’re charged at the beginning of each subscription period. Subscriptions may be managed and auto-renewal disabled via your Google Play app after the purchase.
Please visit our web site for more information. 雷達示波器是氣象愛好者和氣象學家專門的顯示工具,可以讓你與龍捲風,強雷暴,山洪暴發預警,以及由美國國家氣象局發布預測風暴路徑沿著查看NEXRAD Level 3和超分辨率的雷達數據。它可顯示最新的反射率,速度,雙極化,和其他產品在美國,關島和波多黎各任何NEXRAD或TDWR雷達站,以及反射率和速度數據來自加拿大環境部雷達。這些都不是平滑的PNG或GIF圖像,這是在其原始格式徑向呈現用於高細節水平本地雷達數據。
無論您是掃描反射率的中氣旋的搬弄是非的鉤狀回波,試圖找出颶風的眼壁的登陸,或者尋找小功能,如在風暴相對徑向速度產品的速度對聯,雷達顯示器讓您可以查看正放射狀電源在Android設備上NEXRAD氣象雷達。
當有任何龍捲風警告(用紅色標出),強雷暴天氣警告(黃色多邊形),或山洪暴發預警(GREEN多邊形)的影響遍及美國,點擊右上角的警報按鈕瀏覽當前警告列表,查看詳細信息,甚至放大到地圖上選定的警告。
捏或伸展以放大和縮小。拖動手指在地圖上四處滾動。點擊工具欄上的雷達掃描鍵切換雷達。選擇在美國的156不同的新一代天氣雷達雷達站和45個終端多普勒雷達之一,在韓國,加拿大等30雷達站和2。通過點擊位置按鈕畫出你的當前位置,並選擇將其報告給檢舉網絡。點擊播放按鈕,下載和動畫在最近的圖像。如你縮放和滾動顯示超過25,000個城鎮在地圖上的名稱。點擊並按住顏色圖例看到的數據值。
同時,雷達顯示器將檢索並顯示自動和智能更新的數據(大約每2至10分鐘,這取決於雷達掃描策略)。
您可以顯示從NOAA的公共訪問的網站,我們的可選WDT飼料(默認),或您的AllisonHouse用戶帳戶數據。檢舉網絡成員可以報告自己的位置,並查看其他檢舉的位置。
該雷達示波器專業版是一個可選的自動更新的訂閱與兩個不同的層次選擇。超高分辨率產品仍然提供給所有用戶雷達顯示器,而無需購買訂閱。
雷達示波器臨1級可以訪問實時的閃電資料與雷達循環和高達雷達數據的20幀,包括*延長循環*超級RES 2級數據的動畫一起。第1層的用戶也可以訪問數據詢問工具快速確定用於特定雷達像素和數據值用於觀看兩個雷達產品側由端的可選雙窗格模式。
雷達示波器臨二級結合了1級與更先進的功能,包括所有的雷達產品30天的歸檔,預計冰雹大小的輪廓,旋轉(方位剪切)的輪廓,以及跨多個平台使用訂閱功能的能力,所有的功能。
如果您選擇購買雷達顯示器專業版,它會收取您的谷歌Play帳戶。訂閱自動更新,而你在每個認購期開始時加入。訂閱可管理和自動更新通過購買後您的谷歌Play應用程序禁用。
請訪問我們的網站了解更多信息。